 Real
RealPresentations · Infographics · Classroom activities
Projects
The resources and outreach we've built to help people spot misinformation and stay safe from cyberbullying, shared with schools, libraries, summer camps, and retirement communities.
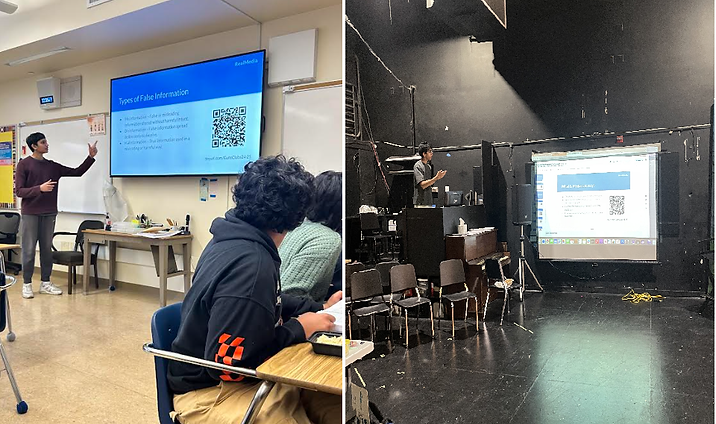
School Club Presentations
Talks delivered to clubs across the Palo Alto Unified and Fremont Union districts (AI & Policy, Voices of Unity, Geopolitics, Architecture, and Playwright), each tailored to show how misinformation and cyberbullying show up in that field.
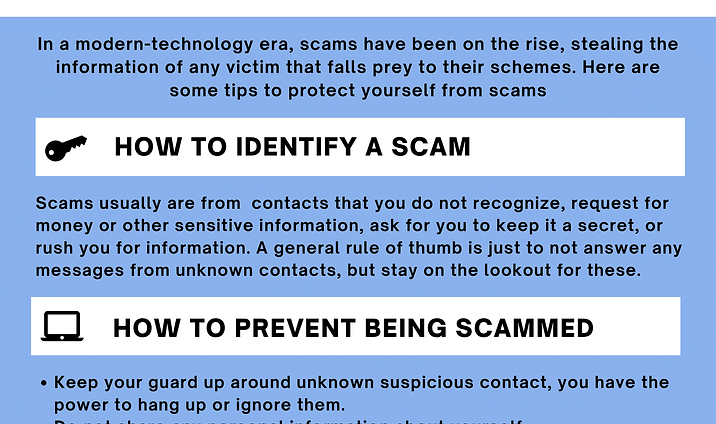
"Stay One Step Ahead" Infographic
Practical guidance for recognizing, preventing, and recovering from scams: red flags like urgent requests or demands for secrecy, plus simple steps to stay safe. Shared with libraries, schools, camps, and retirement homes.
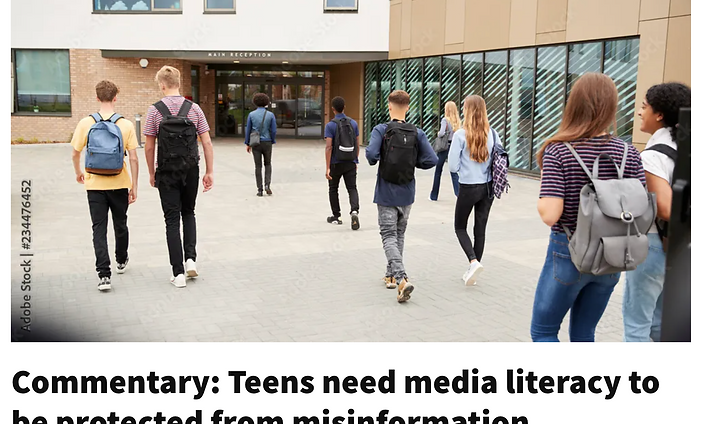
Teens Need Media Literacy to Be Protected from Misinformation
An opinion piece on the growing impact of misinformation on teens, and the urgent case for media literacy in schools, published as part of RealMedia's outreach.
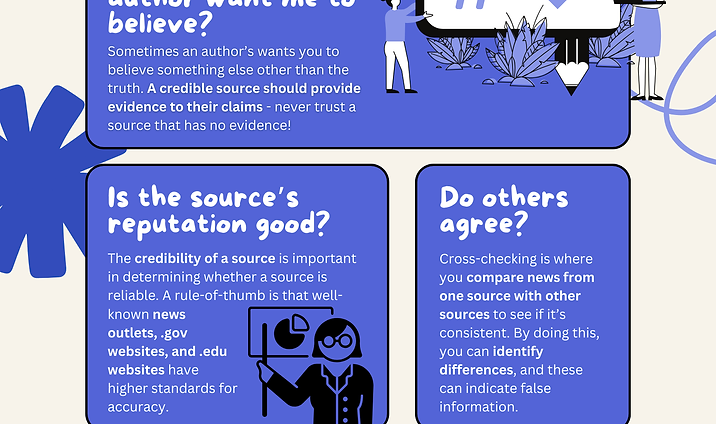
"Think like a Journalist" Infographic
A prompt to slow down and question what you read online, examining an author's intent, cross-checking sources, weighing credibility, and consulting experts. Made to keep media literacy straightforward and accessible.
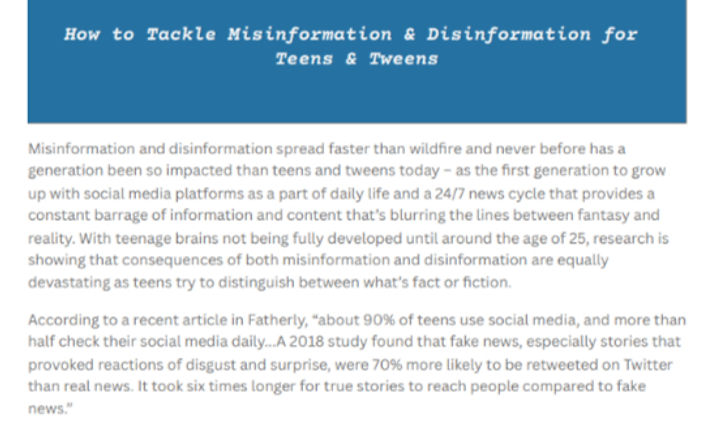
How to Tackle Misinformation
An interactive activity built to strengthen teens' media literacy: how misinformation spreads, how to evaluate source credibility, and how to think critically about what they read and share online.
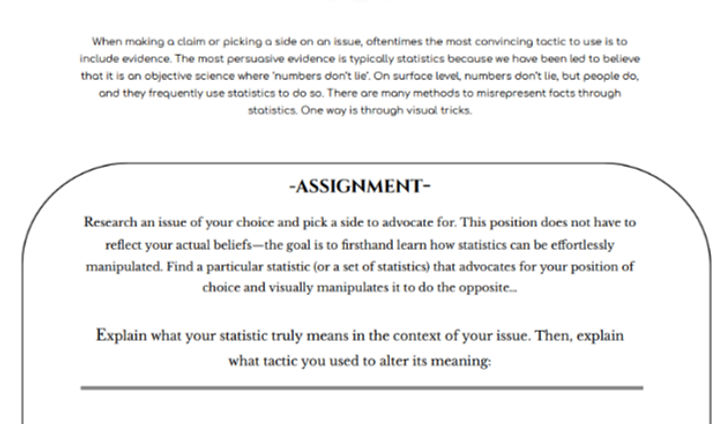
"The Power of Misrepresenting Statistics" Handout
A classroom activity showing how data gets distorted: students pick a position and build a visual that intentionally misleads, learning firsthand to question numerical claims and spot deceptive charts and framing.
December 2025 – May 2026
Where we’ve presented
Every session is built for the room it’s going into. Fourth graders and retirement community residents need different examples, different language, and different advice.
-
How Algorithms Shape What You Believe
~20 studentsGunn High School · AI Ethics Club · Grades 11–12
How recommendation engines optimize for engagement over accuracy, why outrage spreads faster than correction, and how to audit your own feed.
The club invited us back for a follow-up in the spring.
-
Misinformation and Its Impact on Marginalized Communities
~18 studentsGunn High School · Voices of Unity Club · Grades 9–12
How false narratives disproportionately target specific communities, how to identify coordinated inauthentic behavior, and how to respond without amplifying harmful content.
-
Stay One Step Ahead: Avoiding Online Scams
~25 adultsPalo Alto City Library · Community workshop
A live walkthrough of our scam-avoidance infographic: urgency tactics, secrecy demands, and impersonation red flags.
The infographic is still displayed at the library’s information desk.
-
Cyberbullying: Recognizing It, Reporting It, Stopping It
~30 studentsCupertino Middle School · Classroom visit · Grade 7
The difference between conflict and harassment, bystander versus upstander behavior, and concrete reporting steps on the major platforms.
The teacher requested our activity worksheet for ongoing use in advisory periods.
-
The Power of Misrepresenting Statistics
~20 studentsGunn High School · AI Ethics Club, return visit · Grades 11–12
Students built charts designed to mislead, then swapped and tried to catch each other’s manipulations.
-
Raising Critical Thinkers in the Age of Social Media
~20 parentsEast Palo Alto Library · Family workshop · Parents and caregivers
Age-appropriate conversations about misinformation, how to model source-checking behavior, and platform safety settings.
Conducted in English and Spanish, with translated handouts.
-
Spotting Scams and Fake News Online
~35 seniorsThe Terraces at Los Altos · Resident workshop
Phone and email scams, reverse image search, and when to distrust a headline.
Our scam-avoidance infographic was distributed to every attendee.
-
Think Like a Journalist
~22 studentsPalo Alto High School · Model United Nations Club · Grades 9–12
Source triangulation, telling primary from secondary sources, and spotting emotionally manipulative framing in international news coverage.
-
What Is Fake News? A Guide for Young Readers
~24 studentsPalo Verde Elementary · Classroom visit · Grade 4
Media literacy adapted for younger readers: how to tell whether a website is trustworthy, why people share things that aren’t true, and what to do when you’re not sure.
The teacher requested a follow-up visit for the fall.